Flange Leakage in Hydrogen-Cooled Pipeline Systems of Thermal Power Plants
Abstract: The hydrogen-cooled supply pipeline system in thermal power plants is a pressure-bearing network composed of valves, flanges, joints, and other pressurized components. Among these components, detachable connections are especially prone to hydrogen leakage due to sealing degradation caused by preload relaxation, creep deformation, external mechanical forces, and internal pressure. This study investigates the leakage behavior of a commonly used DN50 flange–gasket–bolt assembly through finite element analysis (FEA). Simulation results show that after 4,610 hours of creep, the average sealing stress dropped to 8.04 MPa, and further decreased to 7.667 MPa after 7,000 hours, indicating a loss of sealing integrity and the initiation of hydrogen leakage. These findings offer valuable insights for developing predictive maintenance strategies to prevent hydrogen leakage in the cooling systems of thermal power plants.
Introduction
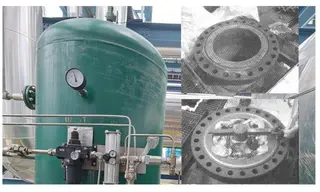
Hydrogen leakage is a common problem in the hydrogen cooling systems of thermal power plants. These systems typically consist of interconnected pipelines assembled with flanges, valves, and other fittings. Due to the combined effects of preload relaxation, material creep, external mechanical forces, and internal pressure, the sealing performance of these components gradually deteriorates over time—especially in detachable connections—resulting in increased risk of hydrogen leakage. Given hydrogen’s high flammability and explosiveness, such leakage poses a significant risk to the safe and stable operation of thermal power units. Numerous domestic and international studies have examined the risks of hydrogen leakage in cooling systems, often drawing on field engineers' practical experience and providing detailed case analyses. For example:
Wei Pengfei et al. investigated detection methods, root cause analysis, and mitigation strategies for hydrogen leakage in generators.
Wu Tao reviewed failure types, causes, and preventive measures associated with hydrogen cooling systems.
Ji Jun et al. proposed on-site plugging techniques to effectively address hydrogen leakage.
Gyan R. et al. introduced a redesigned hydrogen cooling system and evaluated its reliability compared to existing systems using fault tree analysis.
Mohammadfam I. et al. developed two risk assessment methods for hydrogen production facilities: a qualitative approach using HAZOP and PRA, and a hybrid quantitative method combining event tree analysis (ETA) with numerical techniques.
Notable contributions in the field of finite element modeling for hydrogen leakage include:
Li Yunhao, Yu Yuan, and Zhang Qingwu from Nanjing University of Technology simulated hydrogen concentration distribution resulting from fuel cell leaks in parking garages.
Li Feng and Yuan Yupeng from Wuhan University of Technology conducted modeling studies on hydrogen leakage in fuel cell enclosures.
Haji YI and collaborators conducted leakage simulations for hydrogen distribution stations.
This study builds upon previous research by focusing on the long-term sealing performance of flange connections under operating conditions, aiming to provide technical guidance for failure prevention and maintenance planning in thermal power plants. This study compiles and analyzes hydrogen leakage records from several domestic thermal power plants, presenting the results in a probability bar chart (see Figure 1) The chart reveals that the most common leakage points in hydrogen cooling system pipeline networks are flange–gasket–bolt assemblies and valves, accounting for 37.2% and 29.7% of all leakage incidents, respectively. Based on this analysis, the study focuses on the widely used DN50 flange–gasket–bolt assembly. A numerical simulation approach is employed to investigate the root causes of leakage in this structure. The findings are expected to offer valuable guidance for predictive maintenance and contribute to preventing flange leakage in hydrogen-cooled supply pipelines of thermal power plants.

Figure 1 Leakage ratio of each part in the hydrogen cooling system pipeline of a thermal power plant
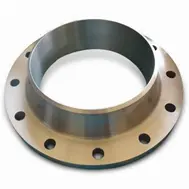
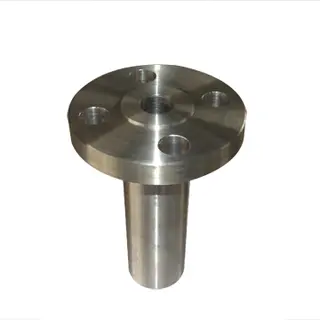
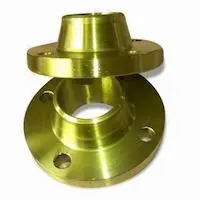
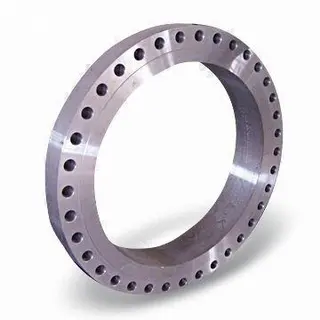
Figure 2 Schematic diagram of flange connection structure
1. Flange Connection Structure and Key Parameters
1.1 Finite Element Model of the Flange Assembly
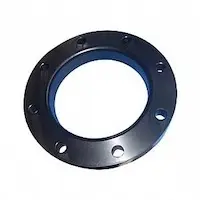
This study focuses on a DN50, PN1.6 MPa plate-type flat-welded steel pipe flange, the most commonly used connection in hydrogen-cooled generator supply lines of modern thermal power plants. The sealing is provided by a chloroprene rubber (CR) gasket, designed for a specific seating pressure of 8 MPa. Figure 2 illustrates the overall flange connection layout, while Figure 3 shows the finite element (FE) geometry of the flange–gasket–bolt assembly used in the numerical analysis. Figure 1 shows the leakage distribution in an actual hydrogen-cooling pipeline network, with flange joints and valves accounting for the largest proportion of recorded hydrogen leaks.
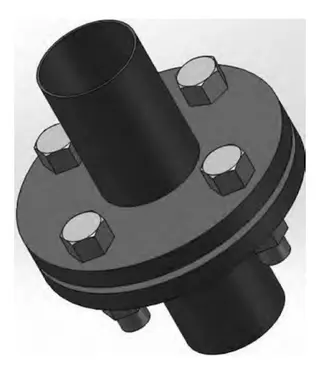
Table 1 — Principal Dimensions of the DN 50 Flange
|
Item |
Symbol |
Value (mm) |
Notes |
|
Pipe outside diameter |
A |
62 |
Matches DN 50 schedule |
|
Flange outside diameter |
D |
165 |
Plate type, flat welded |
|
Bolt circle diameter |
K |
125 |
Center line of bolt holes |
|
Bolt hole diameter |
D<sub>n</sub> |
18 |
Drilled clearance holes |
|
Number of bolt holes |
— |
4 |
Equally spaced |
|
Bolt specification |
— |
M16 |
Carbon steel studs |
|
Flange thickness |
C |
17 |
Measured at the hub |
Table 2 — Principal Dimensions of the Chloroprene Rubber Gasket
|
Item |
Value (mm) |
|
Inside diameter |
59 |
|
Web outside diameter |
78 |
|
Thickness |
3 |
1.2 Material Parameters
The material properties of the DN50, PN1.6 MPa plate-type flat-welded steel pipe flange, as specified by the Chinese national standard, are listed in Table 3. To accurately simulate the mechanical behavior of each component under operating conditions, bilinear and multilinear elastic–plastic material models are employed in the finite element analysis (FEA). Figure 4 shows the compression–rebound performance curve of the neoprene gasket, illustrating its nonlinear elastic behavior under sealing pressure.
Table 3 — Material Properties of Flange Assembly Components
|
Part |
Material |
Elastic Modulus (E) / Pa |
Yield Strength / Pa |
Shear Modulus / Pa |
|
Flange |
Stainless Steel |
1.93 × 10¹¹ |
2.07 × 10⁸ |
7.37 × 10¹⁰ |
|
Bolt |
Carbon Steel |
2.10 × 10¹¹ |
2.35 × 10⁸ |
8.00 × 10¹⁰ |
|
Nut |
Carbon Steel |
2.10 × 10¹¹ |
2.35 × 10⁸ |
8.00 × 10¹⁰ |
|
Gasket |
Neoprene Rubber |
— |
— |
— |
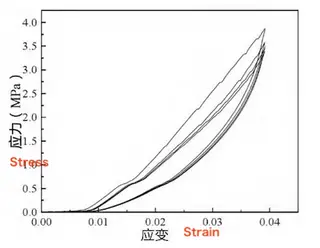
Figure 4: Compression–rebound performance curve of the neoprene gasket
1.3 Finite Element Mesh Model
To simulate hydrogen leakage under initial stress conditions, this study analyzes the stress distribution at the flange–gasket interface during the initial operating state. Mesh independence was verified by comparing gasket stress values, as summarized in Table 4. Balancing computational efficiency and result accuracy, a mesh size of 106,552 elements was deemed sufficient. The finite element mesh model is shown in Figure 5.
Table 4 — Mesh Independence Verification Results
|
Number of Elements (a) |
Max Gasket Compressive Stress (a) / MPa |
Number of Elements (b) |
Max Gasket Compressive Stress (b) / MPa |
Stress Difference (%) |
|
2,684,716 |
89.23 |
106,552 |
88.50 |
0.58 |
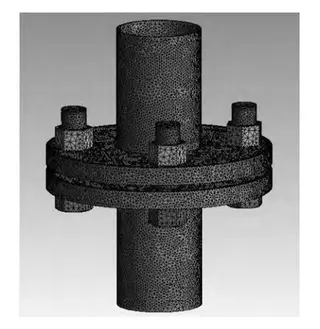
Figure 5: Finite Element Mesh Model of the Flange–Gasket–Bolt Assembly
2. Analysis of Creep-Induced Leakage in Flange Connection Structures
2.1 Finite Element Simulation of Flange–Gasket–Bolt Assembly
Using ANSYS 19.0, this study investigates the creep behavior of the DN50 flange–gasket–bolt assembly subjected to long-term internal pressure. A preload of 21,500 N is applied to the bolts, followed by an internal pressure of 0.3 MPa, to simulate operating conditions in hydrogen-cooled supply pipelines of thermal power plants. This analysis offers valuable insights into the mechanisms of hydrogen leakage caused by creep deformation in bolted flange connections.
(1) Flange Displacement and Deflection Analysis
Under preload and internal pressure, the flange experiences displacement and angular deflection. In the simulation, both internal pressure and membrane stress at the flange’s free end are applied. The membrane stress is calculated using Equation (1):
![]()
Where:
Pe: Membrane stress at the free end (Pa)
R: Average radius of the pipe (mm)
P: Internal pressure = 0.3 MPa
t: Wall thickness (mm)
By substituting the values, the calculated membrane stress is 3.03 MPa.
Figures 6–9 illustrate the deformation analysis results:
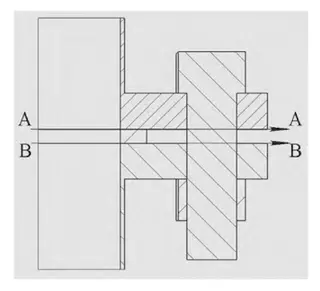
Figure 6: Displacement path diagram
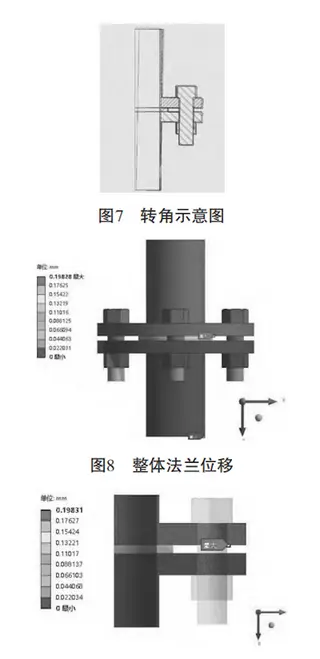
Figure 7: Angular deflection diagram
Figure 8: Maximum flange displacement of 0.19 mm
Figure 9: Quarter-sector view of the flange under combined loading
The results indicate that, due to bolt preload and internal pressure, the flange—being stiffer than the gasket—undergoes overall displacement and deflection.
(2) Flange Stress Analysis
Figures 10 and 11 show the equivalent stress distribution in the upper and lower flanges under a bolt preload of 21,500 N and an internal pressure of 0.3 MPa. The maximum equivalent stress is concentrated at the contact area between the bolt hole and the nut. The upper flange experiences a maximum stress of 21.68 MPa. The lower flange, modeled as the fixed end, exhibits a significantly higher maximum stress of 380.07 MPa.
In both cases, the maximum stress is concentrated around the bolt holes, especially on the side nearest to the pipe wall.
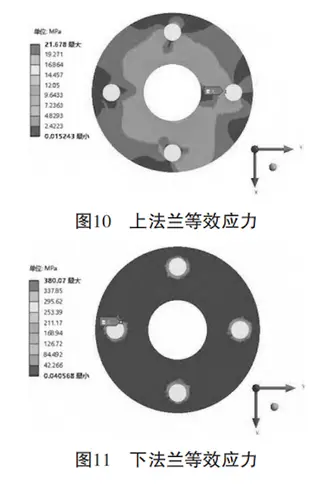
Figure 10: Equivalent stress distribution in the upper flange
Figure 11: Equivalent stress distribution in the lower flange
(3) Bolt Strength and Stress Analysis
Due to bolt preload, the stress distribution in both the bolt and bolt hole is uneven across axial and cross-sectional directions. The maximum contact stress between the bolt and flange reaches 380.07 MPa (see Figure 12).
The maximum internal stress within the bolt reaches 353.74 MPa, as shown in Figures 13 and 14.
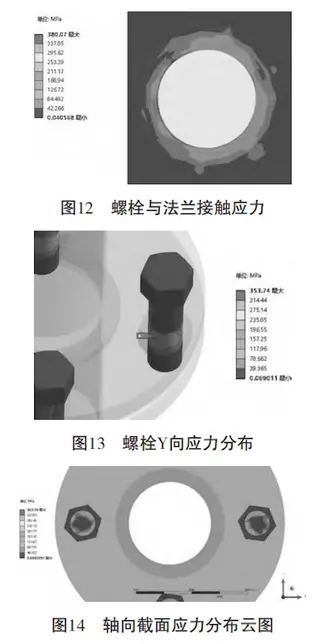
Figure 12: Contact stress between the bolt and flange
Figure 13: Bolt stress distribution along the Y-axis
Figure 14: Axial cross-sectional stress cloud map of the bolt
(4) Gasket Stress and Compression Analysis
The selected gasket material is chloroprene rubber, designed for a sealing specific pressure of 8 MPa. Due to its lower stiffness compared to the flange, the gasket deforms under bolt preload to achieve an effective seal. Compressive stress decreases radially inward.
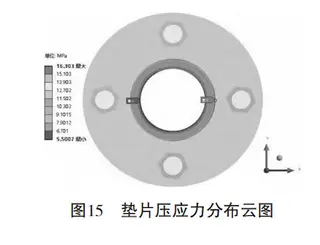
Figure 15 The gasket compressive stress distribution
Maximum compressive stress: 16.30 MPa
Minimum compressive stress: 5.50 MPa
Average compressive stress: 10.64 MPa, meeting the sealing requirement.
Figure 16 shows the gasket compression distribution, indicating:
Maximum compression: 0.0064 mm
Minimum compression: 0.0028 mm
Compression decreases radially inward, consistent with the stress distribution.
Figure 17 illustrates the combined distributions of compressive stress and compression, showing consistent radial patterns for both parameters.
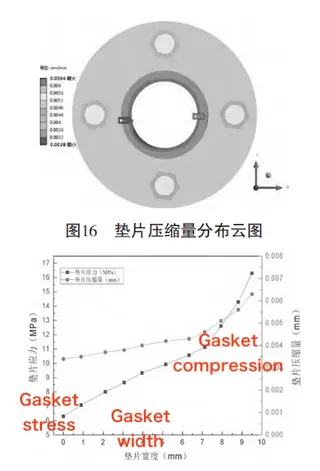
Figure 16: Gasket compression distribution cloud map
Figure 17: Combined compressive stress and compression distribution cloud map
2.2 Finite Element Simulation Study of Creep in the Flange–Gasket–Bolt Structure
Over extended service periods, creep deformation may occur in the flange connection structure, leading to changes in internal stress distribution and degradation of overall sealing performance. This section presents a finite element simulation of creep to evaluate the long-term behavior of bolts, flanges, and gaskets under sustained pressure.
(1) Bolt Stress and Creep Analysis
Under continuous internal pressure of 0.3 MPa, bolt preload gradually decreases over time due to creep, affecting both bolt stress and gasket sealing force.
Figure 18 shows the bolt stress distribution after 4,610 hours of creep simulation, with a maximum stress of 289.39 MPa.
Figure 19 presents the stress distribution after 7,000 hours, showing a reduced maximum stress of 278.08 MPa—a decrease of 75.66 MPa from the initial value at 0 hours.
Further analysis of the stress and strain fields after 7,000 hours, shown in Figures 20 and 21, reveals that stress and strain exhibit similar distribution patterns. Key findings include:
Maximum stress: 278.08 MPa
Maximum strain: 0.0026 mm
To analyze local variations, two points (A and B) along the bolt’s Y-direction were selected (see Figures 22 and 23). The results indicate:
Stress at Point A gradually decreases over time.
Stress at Point B shows a slight increase, reflecting stress redistribution due to long-term creep.
This stress redistribution also affects the gasket’s stress and strain, potentially leading to sealing degradation over time.
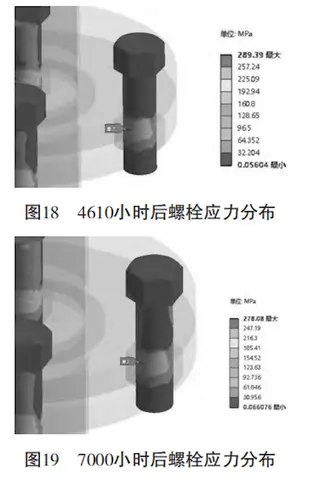
Figure 18: Bolt stress distribution after 4,610 hours of creep simulation
Figure 19: Bolt stress distribution after 7,000 hours of creep simulation
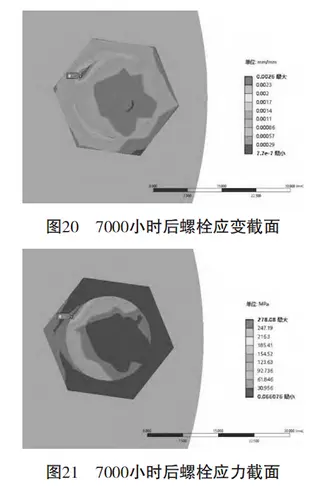
Figure 20: Bolt strain cloud map after 7,000 hours
Figure 21: Bolt stress cross-sectional view after 7,000 hours
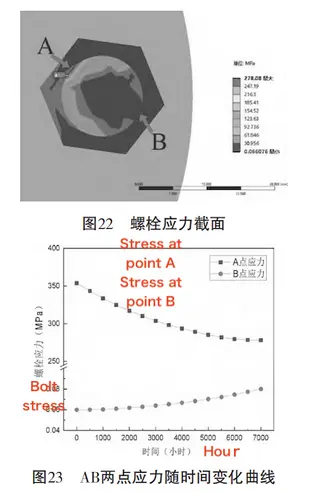
Figure 22: Stress profile along the bolt’s Y-axis
Figure 23: Stress variation over time at points A and B
(2) Gasket Stress Relaxation and Sealing Performance Analysis
Creep deformation of the bolt directly leads to stress relaxation in the gasket. If the gasket stress falls below the rubber material’s minimum sealing pressure, sealing failure and leakage will occur.
Figures 24 and 25 show the gasket stress distribution at the initial state (0 hours) and after 4,610 hours of creep simulation. After 4,610 hours:
The outermost gasket stress is 11 MPa.
The innermost gasket stress is 5.363 MPa.
The average gasket stress is 8.04 MPa, which meets the minimum sealing pressure requirement of 8 MPa for chloroprene rubber.
After 7,000 hours, as shown in Figure 26:
The outermost gasket stress decreases to 10.385 MPa.
The innermost gasket stress further decreases to 5.192 MPa.
The average gasket stress falls to 7.667 MPa, which is below the minimum sealing requirement. Figure 27 illustrates the time-dependent decline in stress at both the inner and outer edges of the gasket. After 7,000 hours, the outer gasket stress decreases by 5.918 MPa, while the inner stress decreases by 5.192 MPa. These results confirm that the gasket no longer maintains the required sealing pressure, indicating a loss of sealing performance caused by long-term bolt preload reduction due to creep.
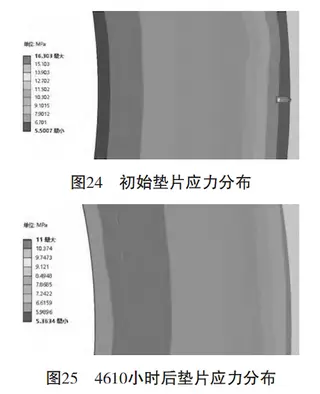
Figure 24: Initial gasket stress distribution
Figure 25: Gasket stress distribution after 4,610 hours of creep
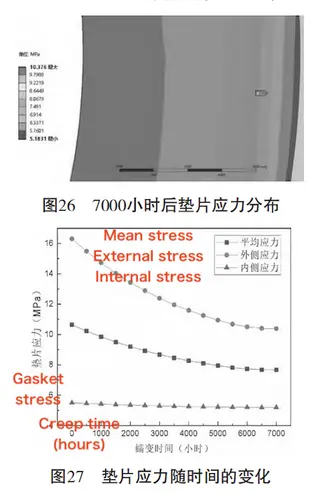
Figure 26: Gasket stress distribution after 7,000 hours of creep
Figure 27: Gasket stress variation over time
Summary of Stress and Sealing Behavior
This section evaluates the stress and strain evolution in the flange–bolt–gasket assembly of a hydrogen-cooled thermal power plant pipeline under a bolt preload of 21,500 N and internal pressure of 0.3 MPa. Key observations include:
Initial Condition (0 hours):
Maximum gasket stress: 16.30 MPa (at outer edge)
Minimum gasket stress: 5.50 MPa
Average gasket stress: 10.64 MPa — meets sealing requirement (≥ 8 MPa)
After 4,610 Hours of Creep:
Maximum bolt stress: 289.39 MPa
Average gasket stress: 8.04 MPa, approaching the minimum sealing pressure limit
After 7,000 Hours of Creep:
Maximum bolt stress decreases to 278.08 MPa, a reduction of 75.66 MPa from the initial value.
Average gasket stress falls to 7.667 MPa, dropping below the minimum sealing pressure.
At this stage, it is evident that the flange–bolt–gasket assembly has lost its sealing capability, making hydrogen leakage likely.
3. Conclusion
For the flange–bolt–gasket assembly analyzed in this study, it is recommended to perform maintenance or replace the flange every 4,500 hours (approximately six months). Within this period, regular leak inspections and monitoring should be carried out at shorter intervals to detect early signs of seal degradation. This proactive maintenance prevents flange deformation caused by external factors such as vibration and significantly reduces the risk of hydrogen leakage accidents in thermal power plant hydrogen-cooling systems.
Send your message to this supplier
Related Articles from the Supplier

Leakages in Check Valve Flanges of Oxygen Pipelines
- Aug 07, 2023
Sealing Treatment on Flange Leakage
- Jul 03, 2014
Analysis of Leakages of Steam Flange Sealing
- Jun 15, 2023
Leakage Cases Happen to Seal Gaskets of Flanges
- Jul 28, 2014
Leakages of Steam Flange Sealing
- May 22, 2023
Related Articles from China Manufacturers

Causes of Flange Seal Leakage in Heat Exchangers
- Mar 25, 2021
Why Attach Much Importance to the Flange Leakage
- Sep 16, 2013

Related Products Mentioned in the Article
Supplier Website
Source: https://www.landeeflange.com/flange-leakage-in-hydrogen-cooled-pipeline-systems-of-thermal-power-plants.html